
Nguồn: tổng hợp
This exercise introduces some common vocabulary and grammar needed for describing graph trends. The language that can be used for describing graphs in IELTS is extensive.
This lesson introduces some of the most common language used. It also shows you how it can be used grammatically in sentences.
Vocabulary for Describing Graph Trends
| Word | Part of Speech | Example Sentence |
|---|---|---|
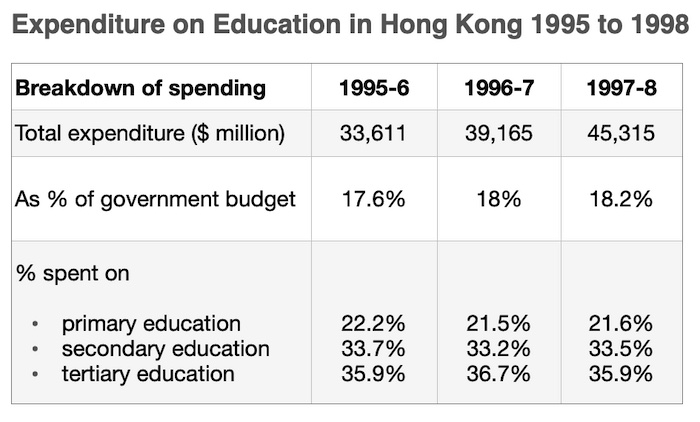
| increase | verb: to increase, is increasing, has increased, increased | Total expenditure increased from $33,611m to $39,165m from 1995 to 1996. |
| noun: an increase of $5,554m an increase in spending of $5,554m | From 1995 to 1996 there was an increase in expenditure of $5,554m. | |
| decrease | verb: to decrease, is decreasing, has decreased, decreased | Expenditure on primary education decreased from 22.2% to 21.5% from 1995 to 1996. |
| noun: a decrease of 0.7% a decrease in spending of 0.7% | From 1995 to 1996 there was a decrease in expenditure of 0.7%. | |
| rise | verb: to rise, is rising, has risen, rose | Total expenditure rose from $33,611m to $39,165m from 1995 to 1996. |
| noun: a rise of $5,554m a rise in spending of $5,554m | From 1995 to 1996 there was a rise in expenditure of $5,554m. | |
| fall | verb: to fall, is falling, has fallen, fell | Expenditure on primary education fell from 22.2% to 21.5% from 1995 to 1996. |
| noun: a fall of 0.7% a fall in spending of 0.7% | From 1995 to 1996 there was a fall in expenditure of 0.7%. | |
| drop | verb: to drop, is dropping, has dropped, dropped | Expenditure on primary education dropped from 22.2% to 21.5% from 1995 to 1996. |
| noun: a drop of 0.7% a drop in spending of 0.7% | From 1995 to 1996 there was a drop in expenditure of 0.7%. | |
| -ing forms | After an introductory clause that includes some analysis; e.g. ‘Spending rose in all three years’, an ‘_ing’ form can be used to describe numbers and dates. | Spending rose in all three years, increasing from 17.6% to 18% from 1995 to 1996, and then rising again to 18.2% in 1997-8. |
Practice
Have a look at the table below.
Then, to help you with describing graph trends, decide which word should go in the gap in the example answer.
- increases increased increasing
- was rose to reached
- increased dropping rising
- an increase increased increasingHowever, the percentage of expenditure spent on primary, secondary and tertiary education did not show the same consistent (5)_______. In 1995-6 expenditure on primary education was 22.2% of the education budget, 33.7% (6)_________ on secondary, and 35.9% on tertiary.
- rise rose rising
- spent spending was spentIn 1996, (7) ____________ of 0.8% in spending on tertiary education was financed by a (8)_________ in spending of 0.7% in primary and 0.5% in secondary schooling.
- an increase increase was increased
- increase drop droppedIn 1997-8 tertiary spending as a percent of the education budget (9)_________ to its 1995-6 level. The percentage spent on primary education (10)__________ to 21.6% and that on secondary to 33.5%, both figures being less than 1995-6 levels.
- dropped increased returned
- rised rose increase
This lesson will hopefully have helped you with the basics of describing graph trends and some of the different structures you can use.
Remember though this example has only used a few of the words possible for describing change.
It’s important to vary your language so look around the IELTS buddy site for other lessons and model essays.